Introduction
What are futures?
A futures contract is an agreement between two parties, in which the parties agree to exchange some underlying asset at a set price, at some specified time in the future.
For example, consider an upstream oil company (exploration & production). The upstream oil company benefits from higher oil prices, because higher prices allow the company to sell extracted oil for more profit. Suppose the company believes that oil prices will fall next year. If the company does nothing, they risk losing revenues to falling oil prices next year. Instead, the company can sell futures contracts in order to guarantee the current price point for oil sold next year. By locking in the current price, the company is protected against falling prices, but loses out on unrealized revenues if the price of oil rises. Clearly, the seller of futures contracts believes that prices will fall and the buyer of futures contracts believes that prices will rise.
One of the important principles of futures contracts is that their price will always converge to the price of the underlying asset at expiration. In other words, the price of Dec ‘16 oil futures will always converge to the price of oil in Dec ‘16. Why? To eliminate arbitrage opportunities. If the price of a Dec ‘16 oil futures contract was $40 and the price of oil in Dec ‘16 was $20, a smart trader could sell Dec ‘16 contracts at $40, fulfill the contract with oil purchased at $20, and profit off the difference. Similarly, if the price of a Dec ‘16 oil futures contract was $20 and the price of oil in Dec ‘16 was $40, a smart trader could short oil at $40, close the short position with the oil purchased from Dec ‘16 contracts at $20, and profit off the difference. As traders exploit these arbitrage opportunities, the price of oil futures and the price of oil will gradually converge.
Futures have two purposes: hedging exposure to prices (in the case of oil companies) and speculating future prices of an asset. The purpose of this investment strategy is to speculate the future prices of VIX futures.
What is VIX?
Volatility represents the inertia of a securities’ price. High volatility securities are likely to experience dramatic fluctuations in price and low volatility securities are likely to experience smaller shifts in price. There are two kinds of volatility: implied volatility and realized volatility. Implied volatility represents the market’s expectation for future volatility and is determined from options prices and realized volatility represents actual volatility experienced by the market.
VIX is an index that tracks the 30-day implied volatility of the S&P 500. The price of VIX futures contracts represents the market’s expectation for the 30-day implied volatility of the S&P 500 at the expiration of the contract.
Strategy
My trading strategy makes two hypotheses about VIX futures:
- The price of VIX futures contracts will move toward the price of the subsequent futures contract. For example, the price of Jan ‘15 contracts will move toward that of Feb ‘15 and the price of Dec ‘15 contracts will move toward that of Jan ‘16.
- The larger the difference in price between a VIX futures contract and the subsequent futures contract, the larger the magnitude of the move in price will be. For example, if the price of Jan ‘15 contracts is $15, the price of Feb ‘15 contracts is $20, and the price of March ‘15 contracts is $30; then we can expect the price of Feb ‘15 contracts to move the most.
To prove these hypotheses, I found the correlation between the differences in prices of adjacent futures contracts (e.g., Jan ‘15 and Feb ‘15) and the next day price changes (e.g., price of Jan ‘15 on 3/21 and 3/22). The resulting correlation coefficient of r = 0.934 shows a high degree of correlation between price differences and price changes and signifies that our hypotheses are correct.
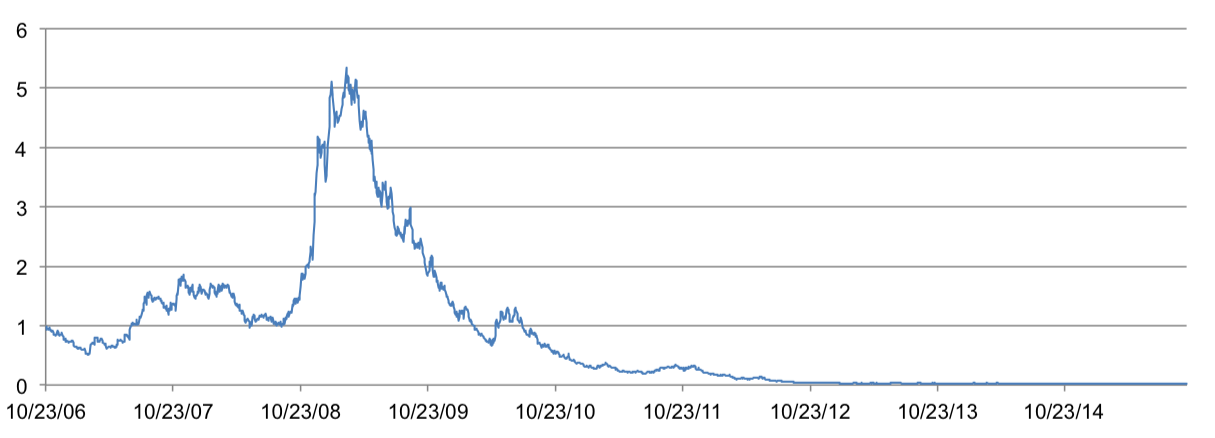
Attempt 1: Long Positive Price Differences
My first attempt at the strategy was to purchase the future with the most positive price difference. Because we have shown positive price differences are highly correlated with positive price changes, I expected this attempt to perform extremely well. However, when I backtested the strategy against 9 years of VIX futures data, I ended up losing all my money! The graph below shows the cumulative returns curve. The curve represents the change in portfolio value at each point in time.
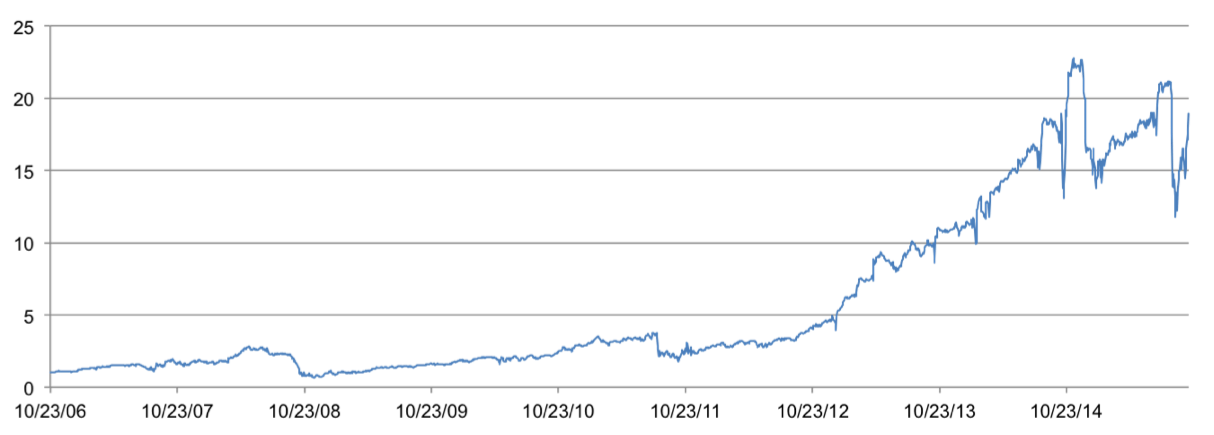
Attempt 2: Short Negative Price Differences
Clearly, my first attempt at the strategy was a complete failure. However, I was not yet ready to give up. My next attempt at the strategy sold the future with the most negative price difference (opposite of attempt 1). This strategy performed significantly better than the previous attempt. It produced positive returns and had a Sharpe ratio of 1.28 since 3/21/12. Sharpe ratios represent returns in excess of the risk-free rate; in other words, Sharpe ratios represent risk-adjusted returns. Sharpe ratios greater than 1 are good, greater than 2 are great, and greater than 3 are excellent. The graph below shows the cumulative returns curve.
Attempt 3: Hybrid
When analyzing futures, it is often useful to define two terms: backwardation and contango. Contango refers to periods of time in which futures contracts are trading at a premium to the current price of the underlying asset and backwardation refers to periods of time in which futures contracts are trading at a discount. The blue line in the graph below represents the current price of VIX (the current 30-day implied vol of the S&P 500) and the line in red represents the average price of all VIX futures contracts. Periods of time in which the red line is below the blue line signify backwardation and periods of time in which the red line is above the blue line signify contango.
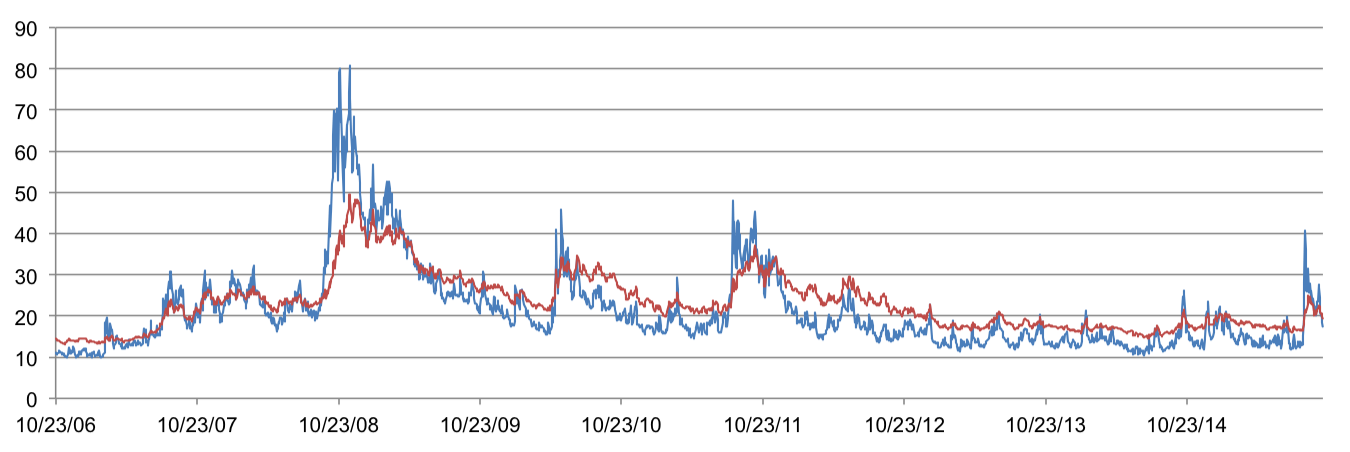
Why were returns so good in the second attempt and so poor in the first attempt? Weren’t both attempts implementations of the same strategy? The answer lies in the graph above. Careful analysis of this graph will reveal an interesting phenomenon. The period of backwardation beginning October 2008 and ending December 2008 lines up perfectly with the spike in returns in the first attempt over the same period. Similarly, the period of contango beginning October 2011 and ending October 2014 lines up perfectly with the spike in returns in the second attempt over the same period.
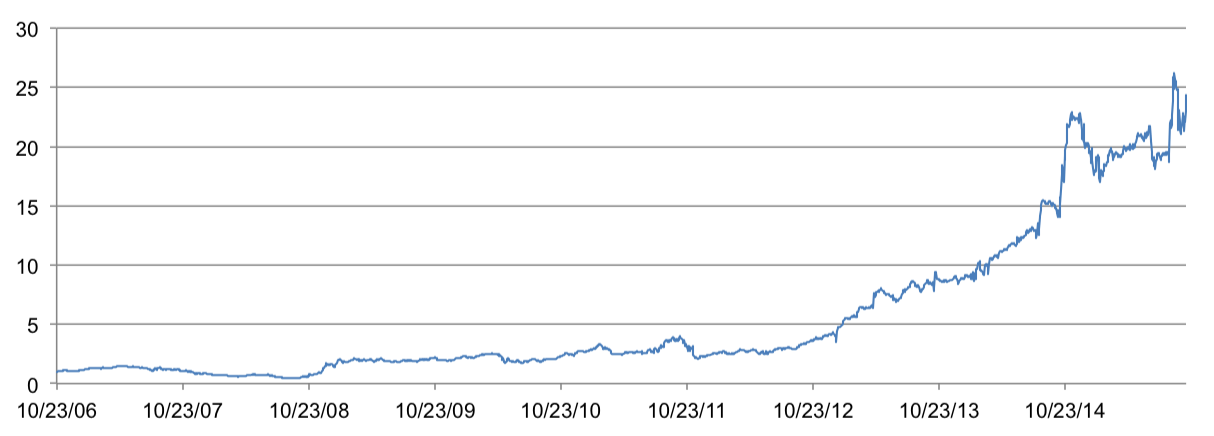
Clearly, the best implementation of this strategy is a combination of the previous attempts. In other words, we should purchase futures contracts with the most positive price difference during periods of backwardation and we should sell futures contracts with the most negative price difference during periods of contango. This hybrid strategy had by far the best results and had a sharpe ratio of 1.68 since 3/21/12. The graph below shows the cumulative returns of this attempt.
Future Work
When professional traders analyze futures, they typically use a three-dimensional model: price, volume, and open interest. Volume represents the total number of contracts that changed hands and open interest represents the total number of outstanding contracts. Changes in volume and open interest are important indicators of futures market behavior:
| Volume | Open Interest | Effect |
|---|---|---|
| rises | rises | Confirms a trend in price |
| rises | falls | Liquidate position |
| falls | rises | Period of congestion; selling, but not buying |
| falls | falls | Period of accumulation; buying, but not selling |
Another important factor to consider when trading futures is time to expiration. A futures contract closer to expiration is likely to converge faster to the market price than a futures contract farther from expiration.
Cover photograph by stockideas.org.